 Plan your work with a Gantt Chart
Gantt charts help project managers to plan projects and coordinate team member activities.
Planning time and effort across a project requires coordination - especially if the project will involve multiple people from different teams. A common way to plan time is with a Gantt chart.
Henry Gantt designed the modern concept of the Gantt chart around 1915. Although Polish engineer Karol Adamiecki developed a similar planning model several years earlier, Gantt's model was more widely adopted.
A simple Gantt chart example
The basic idea of the Gantt chart is to show tasks occurring over time. Typically, this is represented in a timeline format, with time displayed on the horizontal axis and individual tasks in the project represented on the vertical axis. An easy way to create Gantt chart visualizations without special software is with a spreadsheet; create the timeline as columns and enter the tasks as rows. Use a fill color to indicate when the task occurs:
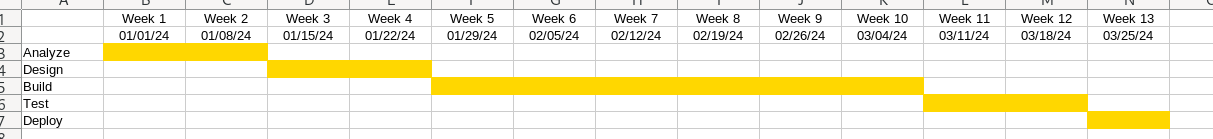
This sample Gantt chart example shows a classic "waterfall" approach to project management, with tasks broken up into Analyze, Design, Build, Test, and Deploy phases.
Adding features to the Gantt chart
In a more detailed Gantt chart, you might represent each overall phase, but with tasks broken out within the phases. At this level, you can still model the Gantt chart using a spreadsheet with fill colors to indicate when each task should take place. Note that this update to the spreadsheet uses formatting to group five days into one week, bold text to highlight the start of each week, and other formatting to separate tasks within the Analyze and Design phases:
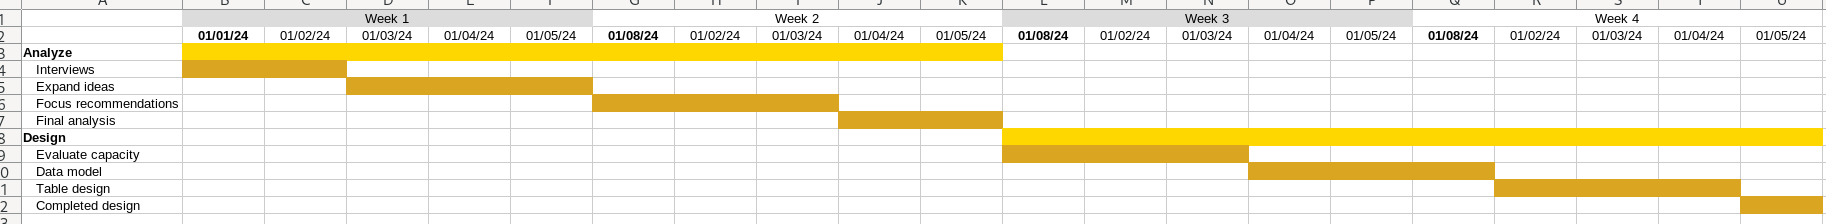
You can add further detail to the Gantt chart by listing the "owners" or performers of each task. For outside project resources, you might also add "effort hours" to each "shaded" region to estimate the time required per day to complete each task, then calculate an overall cost estimate..
Manage projects with Gantt charts
Gantt charts help project managers to plan projects and coordinate team member activities. To apply the Gantt chart for your next project, start with a simple chart and add further detail as needed. Create a high-level chart to show the phases of your project. Then add tasks within each phase, and verify that the time estimates for the tasks line up with the time estimates for the overall phase.

Jim Hall is CEO of Hallmentum, an IT executive consulting company that provides hands-on IT Leadership training, workshops, and coaching. | LinkedIn